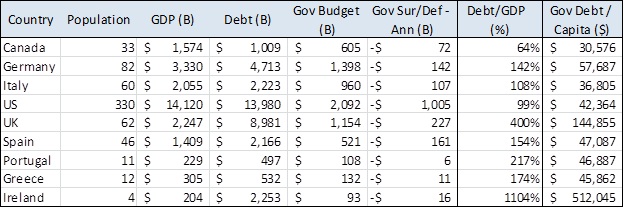
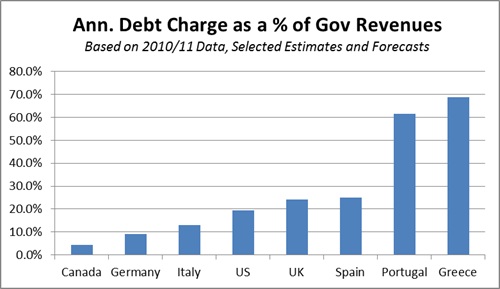
For many, the notion that Greece is in trouble is one thing. But how bad is it really? The following table and graph show the data for several countries. The data is hard to compare for a variety of reasons (more on that in the note below), but let’s start with what we know. The table below shows selected data for 2010/11.

To data geeks, the table is interesting by itself. It certainly highlights a few things. Look at the Debt and the Debt/GDP columns:
-
Overall Greek debt is relatively small compared to other European countries, even if it is outsized for Greece itself.
-
Ireland is off the charts in terms of debt / capita
-
The US which has the highest debt is actually in pretty solid shape relative to the rest.
-
It is interesting to note how, for the most part, the debt/capita numbers don’t look so bad.
-
Canada looks positively like a boy scout on this table.
But now, look at what happens when you compare annual debt repayment charges to Government Budgets (or revenues, in this case).

This begins to show clearly why Greece is suddenly moving into highly unaffordable territory. As interests jump from old expiring debt at attractive rates (around 2-3%) to double that (between 4-6%, based on current market factors) the interest cost doubles, and it goes from high (20-40% of government revenues) to unbelievable and unsustainable at 40-80% or government revenues. Big debts lead to big issues as circumstances (interest rates) change. And the austerity packages are having the effect of shrinking the revenue base, which is further driving up the percent of annual cash devoted to debt service, and no longer available for social programs. It’s small wonder the Greek people are unhappy.
This is the 2011 story of sovereign debt. Debts held by countries, especially western countries, has long been assumed to be unassailable. No more.
Note: This comparison is admittedly a bit tricky, since it requires estimating what the forecast Greek interest rates will be on renewed debt, and that’s why we’ve chosen ranges. However, even making a conservative assumption of about 5% (below market, above European Prime), the data clearly illustrates the issues.
